
How to Define Success for Your Thought Leadership Ads
Results

If you report LinkedIn Thought Leadership Ads in the same columns as your other campaigns, the comparison is broken before you start. Most teams reach for CTR because it is the metric already sitting in every report, and TLAs happen to look spectacular on it. That is exactly the trap: a flattering number is not the same as a true one. In this post we break down why CTR structurally misleads you on this format, and the four metrics we use at Savvy Moves to define success for Thought Leadership Ads across our B2B SaaS clients.
Why CTR is the wrong scoreboard
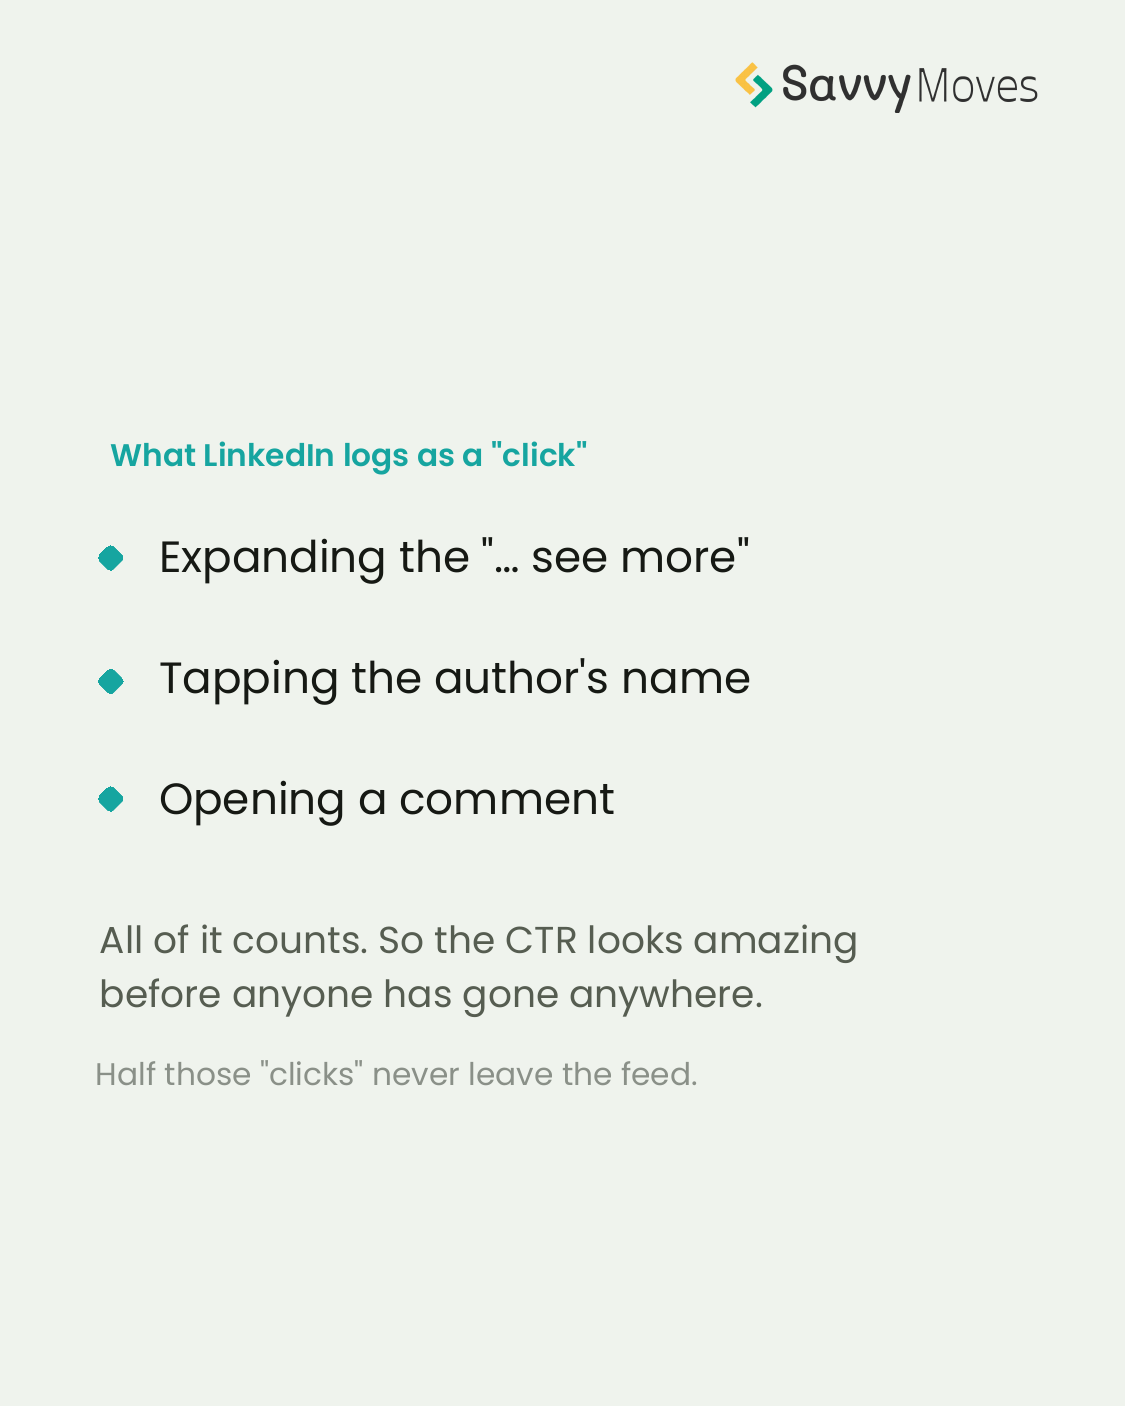
Thought Leadership Ads structurally inflate CTR because of what LinkedIn logs as a click. Expanding the "… see more", tapping the author's name, opening a comment: it all counts. So the CTR looks amazing before anyone has actually gone anywhere, and roughly half of those "clicks" never leave the feed.
This is not a bug in your reporting, it is a property of the format. A single image ad has one meaningful click destination: the landing page. A Thought Leadership Ad is a native post, so almost every interaction with it registers as a click. Comparing the two on CTR is comparing two different definitions of the same word.
None of this means TLAs don't work. It means CTR is the wrong way to prove that they do. Marketing is about attention, so attention is what success should measure.
The four metrics that actually count
1. Average Dwell Time
Did people actually stop and read, or just scroll past? Dwell time is the honest read on whether the message held anyone: attention, not accidental taps. LinkedIn reports it natively in Campaign Manager, so there is no extra tooling required: add the column, and you immediately see which creatives and which authors hold the feed and which get scrolled past. It is also the single best creative-level optimisation signal for this format, because a post that people read for nine seconds is doing a fundamentally different job than one they skim for three.
2. Cost per Attention Hour
What are we paying for real time spent with the message? We take the average dwell time per impression, multiply it by impressions to get total hours of attention, then divide the spend by that: spend ÷ attention hours.
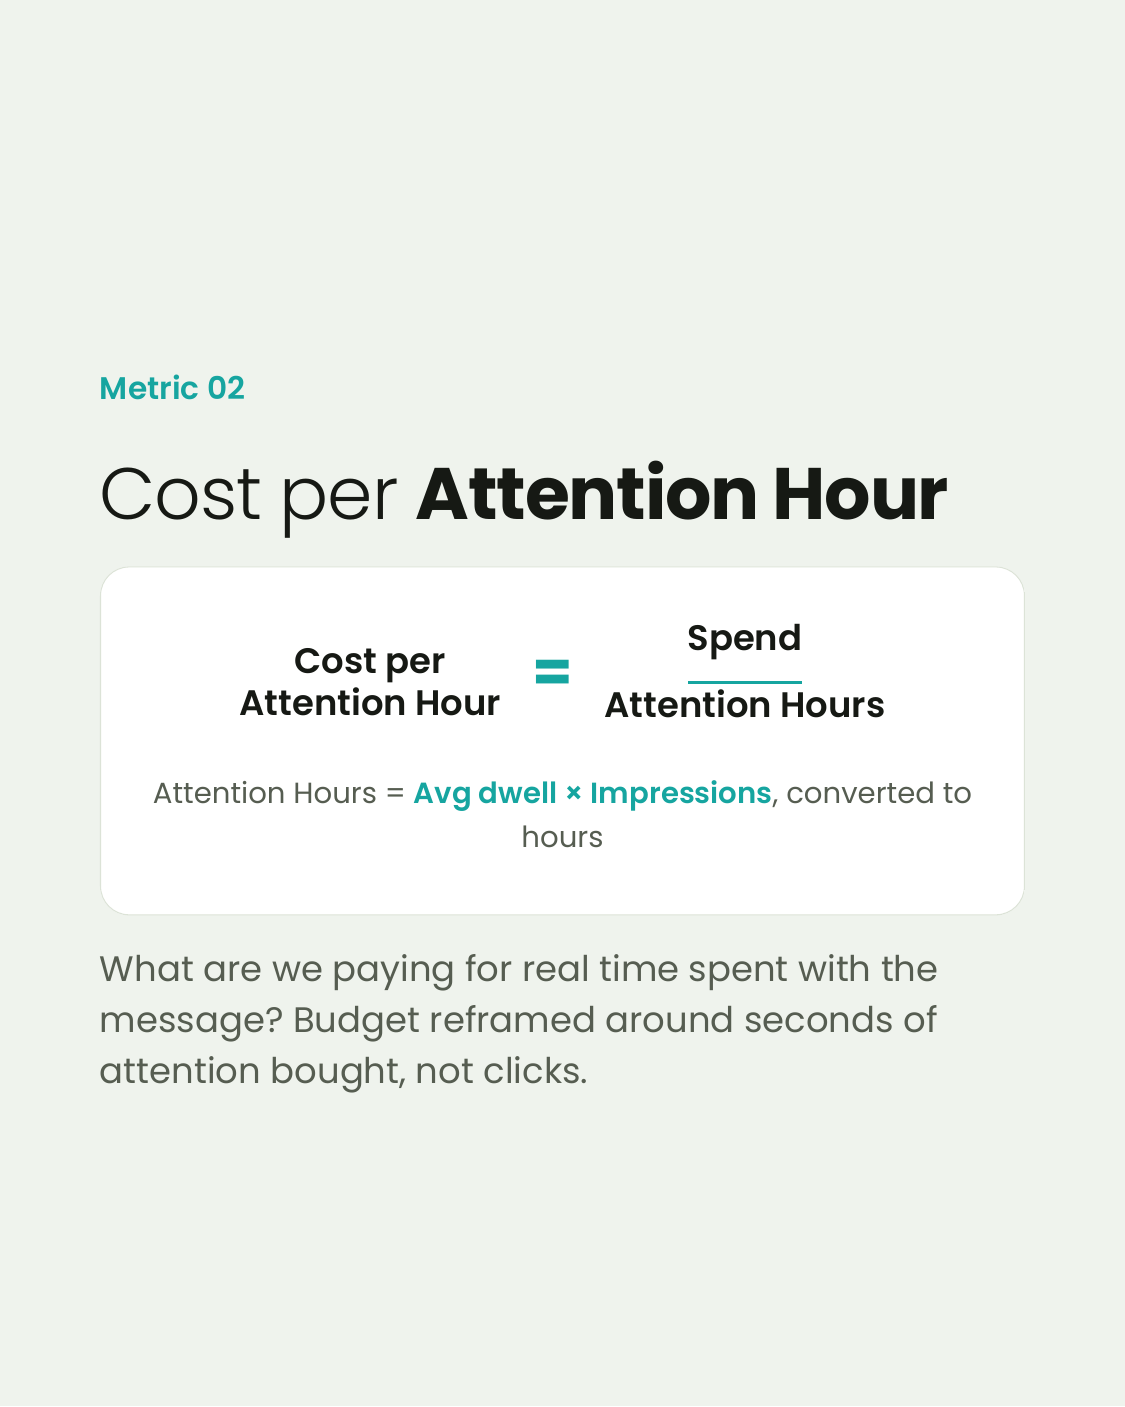
A quick worked example: say a TLA campaign spends €2,000 on 100,000 impressions with an average dwell time of 7 seconds. That is 700,000 seconds of attention, or roughly 194 hours, which puts your cost per attention hour at about €10. Run the same calculation on your single image campaigns and you suddenly have a number that makes the two formats genuinely comparable, because it reframes budget around seconds of attention bought, not clicks that may or may not mean anything.
3. Cost per Landing Page Click
A CTA in the bottom section of the post, linked to your calendar or website, genuinely related to the content and not too salesy, still drives real landing page clicks: the clicks that actually leave the feed. This matters because it rescues the direct-response question from the noise: of everything CTR counts, landing page clicks are the subset that behaves like a normal ad click, so cost per landing page click is the fair way to judge whether the format also drives action.
The craft is in the closing line. It has to read like a natural ending to the post, not a bolted-on ad. We built a Claude skill for our clients that writes these CTAs: it drafts the closing line and link in the author's own voice, so the post reads like a post and still points people somewhere.
4. Pipeline Influence
Long term, this format generates by far the most impact on deals in the pipeline. That is something we measure in Fibbler, which connects LinkedIn Ads reach and engagement to actual deals and revenue in the CRM. Members of buying committees see and read this content for months before a deal ever shows up, and pipeline influence is where that shows. It is the metric that ends in revenue, and the one your CFO will care about most.
The clicks say 7×. The attention says 1.5×.
Here is why this distinction matters in practice. Last month, across all our B2B SaaS accounts, Thought Leadership Ads pulled roughly 7× the CTR of single image ads (2.8% vs 0.4%) and held attention about 1.5× longer (7.0s vs 4.7s average dwell time).
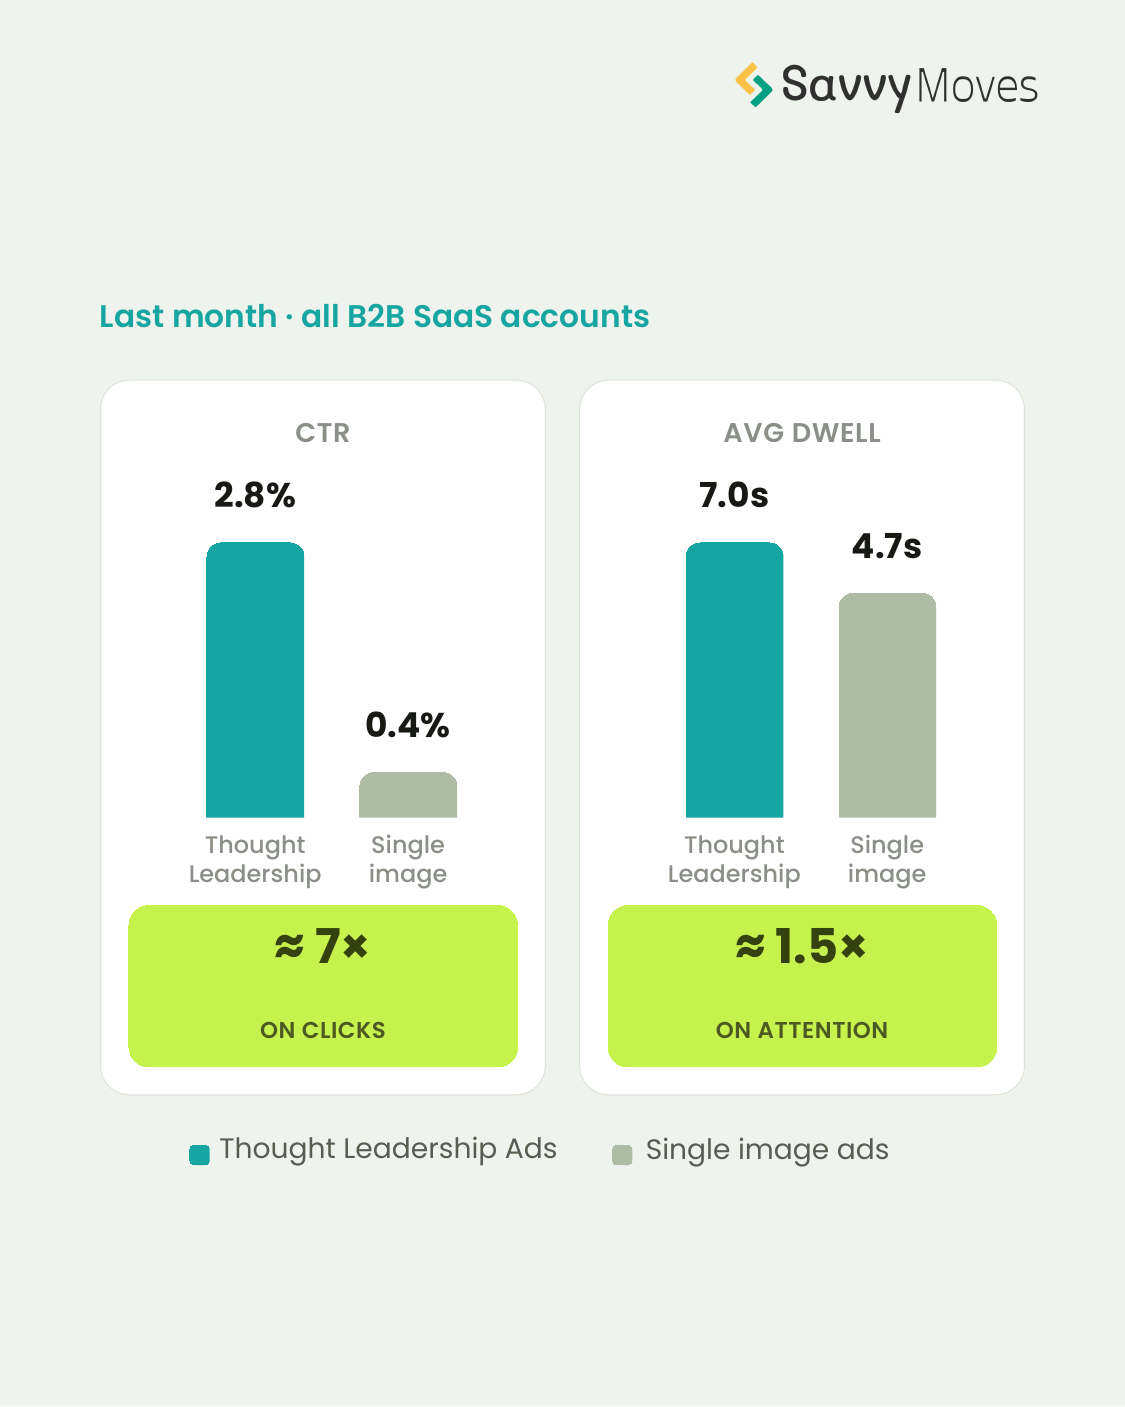
That gap is the whole point. CTR wildly overstates the difference, because half of those clicks are people expanding "see more" or tapping a name. TLAs win on attention. Single image ads stay more predictable for direct response. Different jobs, different metrics, and if you force them into the same columns, you will systematically over-invest in the format that games the metric rather than the one doing its actual job.
How to put this into your reporting
The practical fix is small: give Thought Leadership Ads their own section in the report instead of another row in the campaign table. Score that section on average dwell time, cost per attention hour, cost per landing page click and pipeline influence, and benchmark TLAs against previous TLA periods rather than against your single image campaigns. Keep CTR out of the headline row entirely. You can leave it in the detail for context, as long as nobody is asked to compare it across formats. Once the report is structured this way, the conversation with stakeholders changes from "why is this format so much better?" to "this format buys us cheap, real attention from the right accounts, and here is what that attention turns into."
The takeaway
Define success for Thought Leadership Ads on attention and pipeline, not on the columns you copied from your other campaigns. Report average dwell time and cost per attention hour to show whether the message is landing, cost per landing page click to show it still drives action, and pipeline influence to show it ends in revenue. If you report TLA performance with the same columns as everything else, the comparison is broken by design.
Want help applying this to your own account? Book a call. Related reading: Sendcloud grew qualified pipeline while cutting cost across eight markets and Xomnia turned paid media into a €1M revenue channel.